As air freight falters, China-Europe rail traffic grows
Rail import traffic between China and Europe was up 34% in the first six months of 2020, driven by a strong acceleration of volumes in the second quarter. In 2020, rail moved about as much tonnage as air did between China and Europe.
Figure 1 – EU 27 rail trade weight with China Jan. – June 2020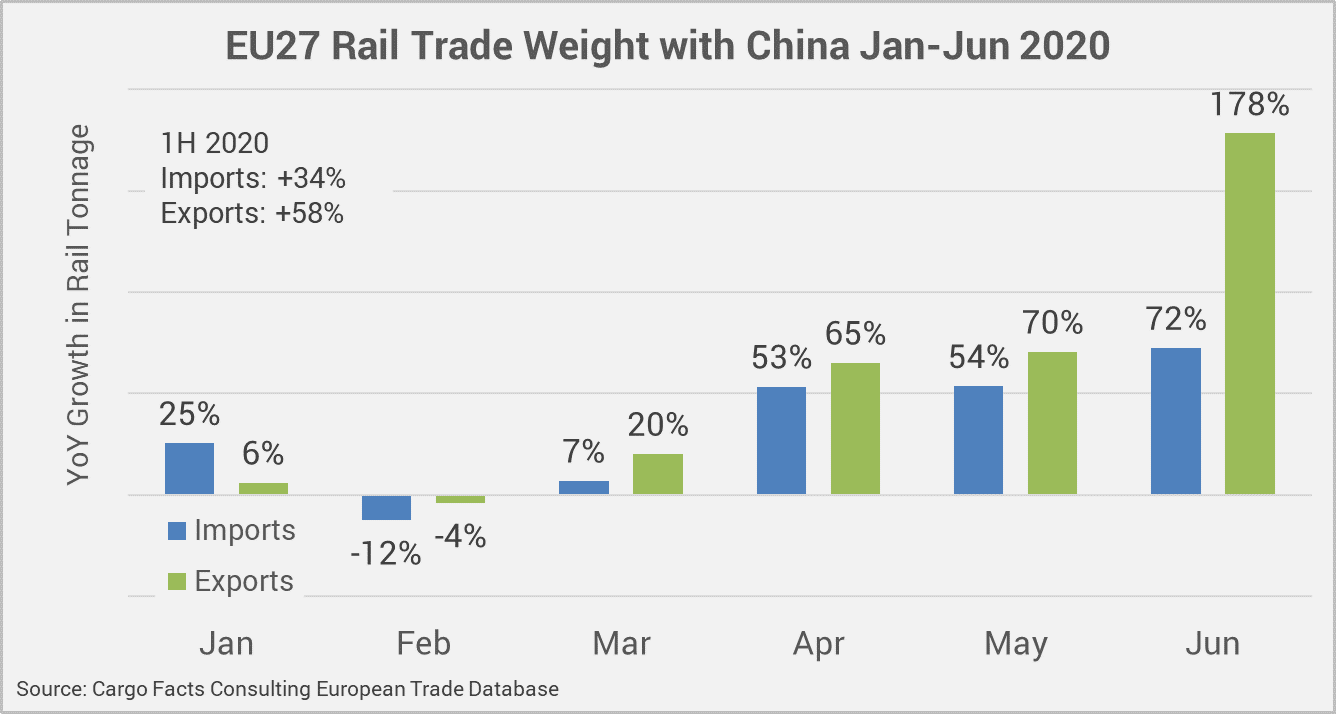
In 2019, air imports to Europe from China and air exports from Europe to China were greater than those moving by rail by about 23% and 42%, respectively. In value terms, the gap remains wider. Air accounted for a total of 22% of the value of products imported from China and 38% of the value of products exported to China. For rail, it was 3% and 2%, respectively, with the balance being transported by sea.
Rail has been the fastest growing mode between Europe and China, with growth in weight averaging 25% per year and growth in value averaging 35% on the import side and 25% on the export side.
Figure 2 – EU28 rail trade weight with China 2014-2019
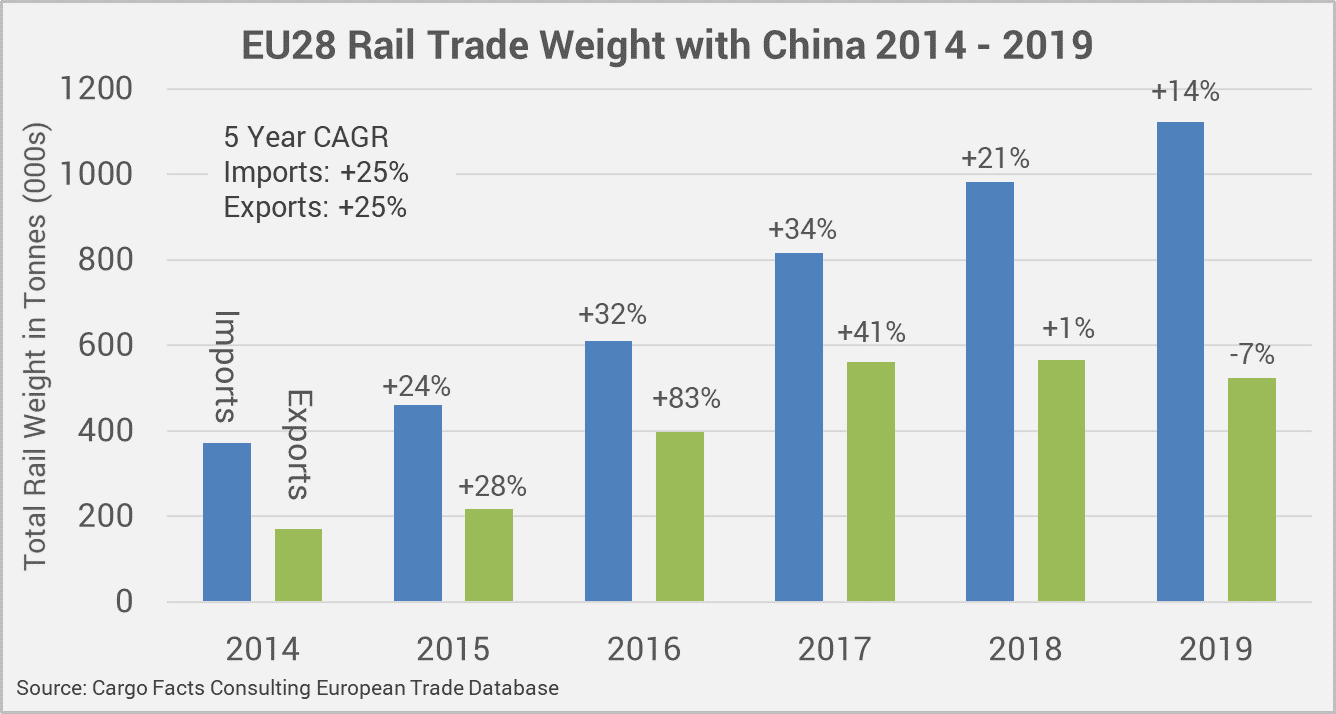
Figure 3 – EU28 rail trade value with China 2014-2019
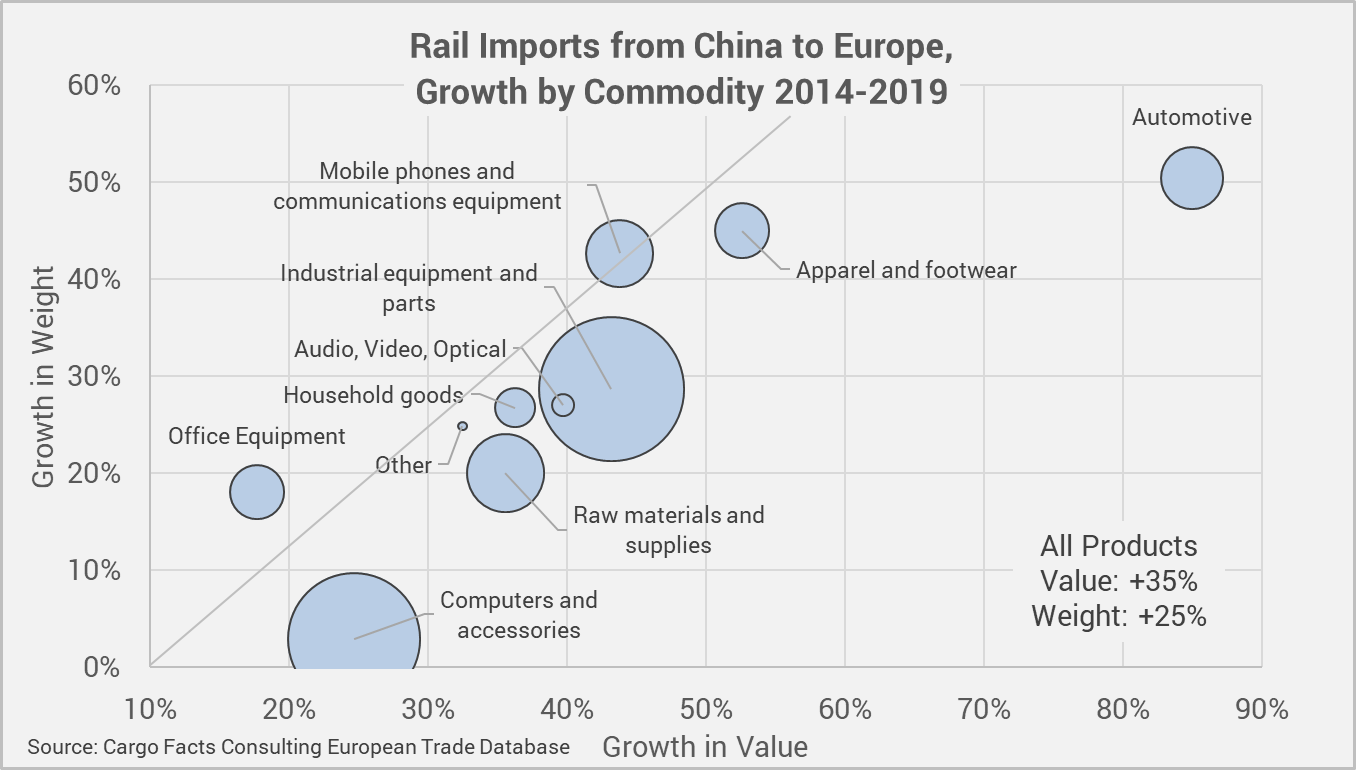
On the import side, the main product groups are: industrial equipment and parts, computers and accessories, industrial raw materials and supplies, mobile phones and communications equipment, automotive, apparel and footwear. While automotive traffic by air saw severe declines in both 2019 and 2020, long haul automotive rail traffic has done very well. The product mix has stayed fairly constant over the years, with the exception of computers and accessories. Some may recall that HP was an early adopter of rail services between Europe and Asia; back in 2017, computers accounted for 38% of the value of rail traffic between China and Europe. Since then, the share has declined to 18%.
Figure 4 – Rail imports from China to Europe, growth by commodity 2014-2019
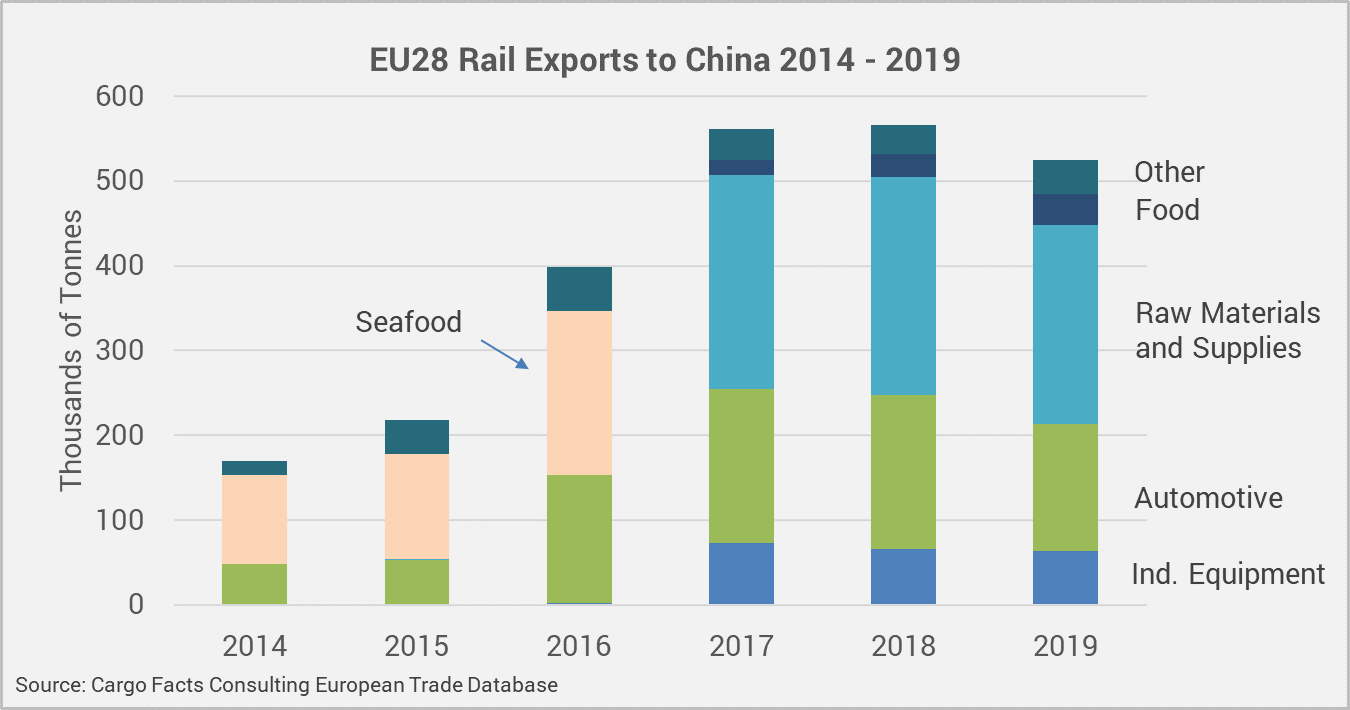
Given that these services were primarily driven by import traffic, it is perhaps unsurprising that the mix of products on eastbound services have varied greatly. In 2014 and 2015, seafood accounted for 60% of the weight of eastbound traffic. Although this traffic increased in 2016, from 120,000 tonnes to over 190,000 tonnes, it decreased when automotive traffic started using the services. Automotive traffic has remained a strong and important component of overall traffic, and seafood all but disappeared in 2017. During the same time, other food products, industrial equipment and industrial raw materials and supplies appeared as important commodity groups.
Figure 5 – EU 28 rail exports to China 2014 – 2019
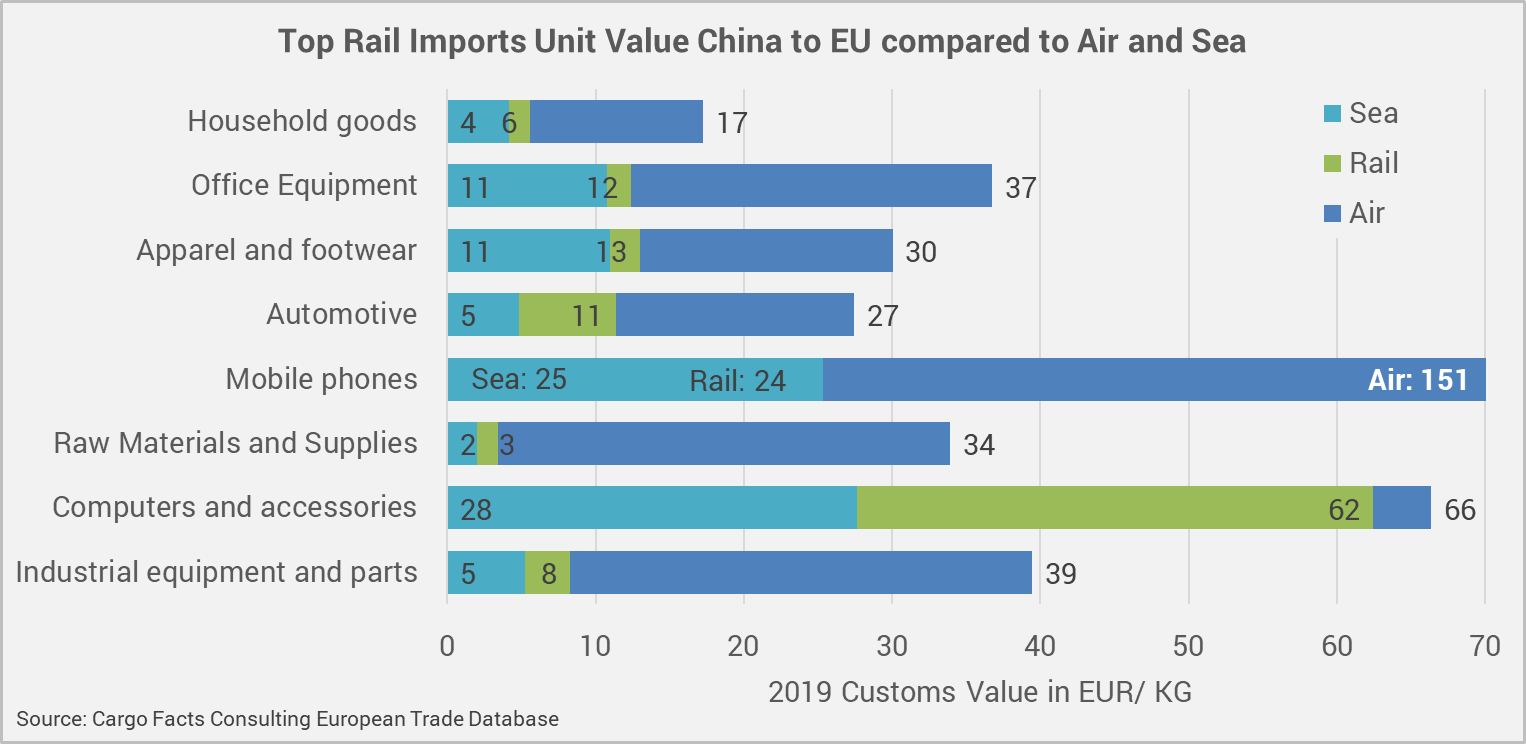
The type of products transported by rail and air between China and Europe are similar, but the value per kg is much lower at 9 euros vs 51 euros per kg on the import side, and 8 euros vs 91 euros per kg on the import side. Only computers and accessories have similar air and sea values. In all other cases, the differences are more pronounced.
Figure 6 – Top rail imports by unit value China to EU28 compared to air and sea
So does rail really present any competition for air? It depends on the price and transit time requirements. Rail is less expensive than air but more expensive then sea. Rail takes 16 to 19 days, compared with an average of 30 days for ocean freight, and about five days for regular air freight service. It is also questionable how much additional capacity the corridor, which crosses multiple countries, can accommodate.