After a 5% decline in 2019, what’s ahead for European air trade?
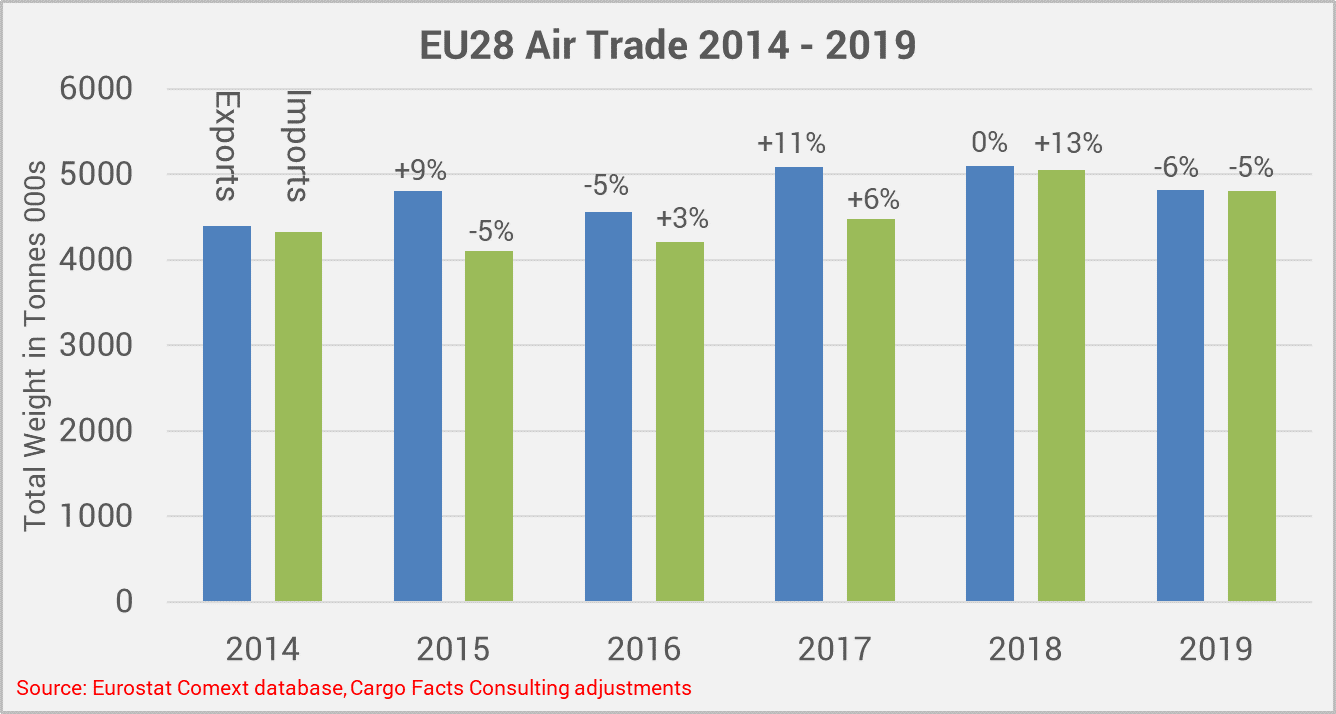
After two strong years, both EU 28 air freight export and import tonnage declined in 2019 pushing average 5 year CAGR down to 2%. Today airfreight imports and exports are only 11% higher than they were in 2014. Figure 1 provides an overview of combined air freight imports and exports into and from all 28 EU Member States, including the United Kingdom. This assessment excludes Switzerland, Norway and Iceland. Particularly Switzerland and Norway are also important export and import markets and are well integrated into other European cargo networks.
Figure 1 – EU Air Trade 2014 – 2019, in Thousands of Tonnes
Performance by Commodity
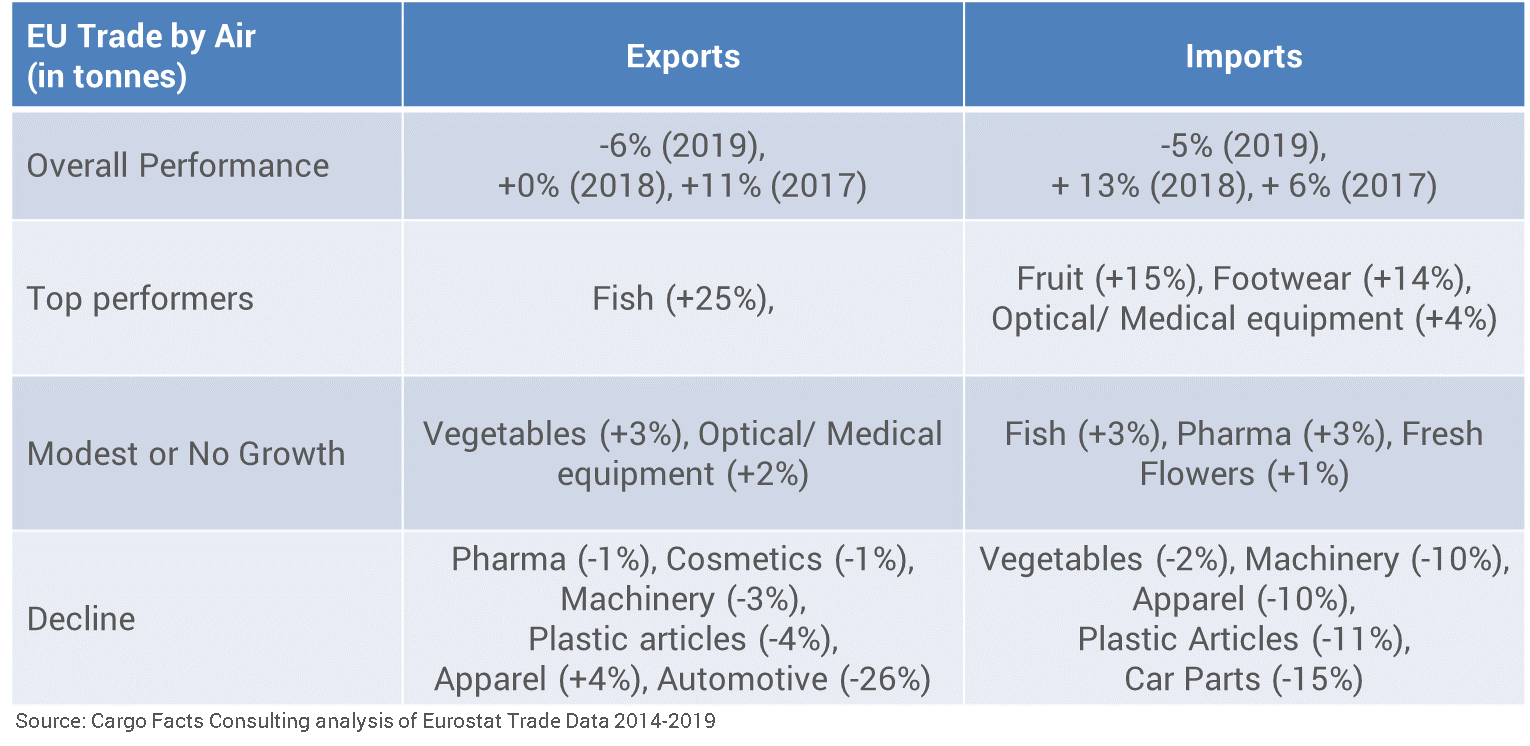
Performance was modest or negative across most key commodity groups, although there were some segments that did well (see Figure 2). Fish Exports (primarily from the UK) were up 25% and vegetable and exports of optical/ medical equipment were 3% and 2% respectively. However, Europe’s main export staple of industrial and other machinery which account for close to 34% of airfreight exports was down three percent. The biggest decline was seen in the automotive sector, where exports or parts were down 26% and imports 15%. Much of the slum in car parts movements was due to a pre-tariff surge in 2018 rather than the ongoing weakness of the car industry.
Most perishable food import categories bar vegetables were up. Fresh flowers, fruit and vegetables account for 7%, 6% and 4% or import weight, respectively. Apparel, which accounts for 10% of imports were down by 10%, but footwear imports increased by 14%.
Figure 2 – Export and Import Performance by Commodity in 2019
Performance by Country
Export and Import air tonnage in was down for all of the top four trading partners – China, the US, Japan and India – which account for almost half of European air freight volumes. China, the largest trading partner accounted for 22% of all airfreight imports and exports in 2019, followed by the US at 20%. Japan and India each accounted for 4%. Most of this can be attributed to general economic weakness after a number of years of decent growth.
Figure 3 – Import and Export performance by trading partner
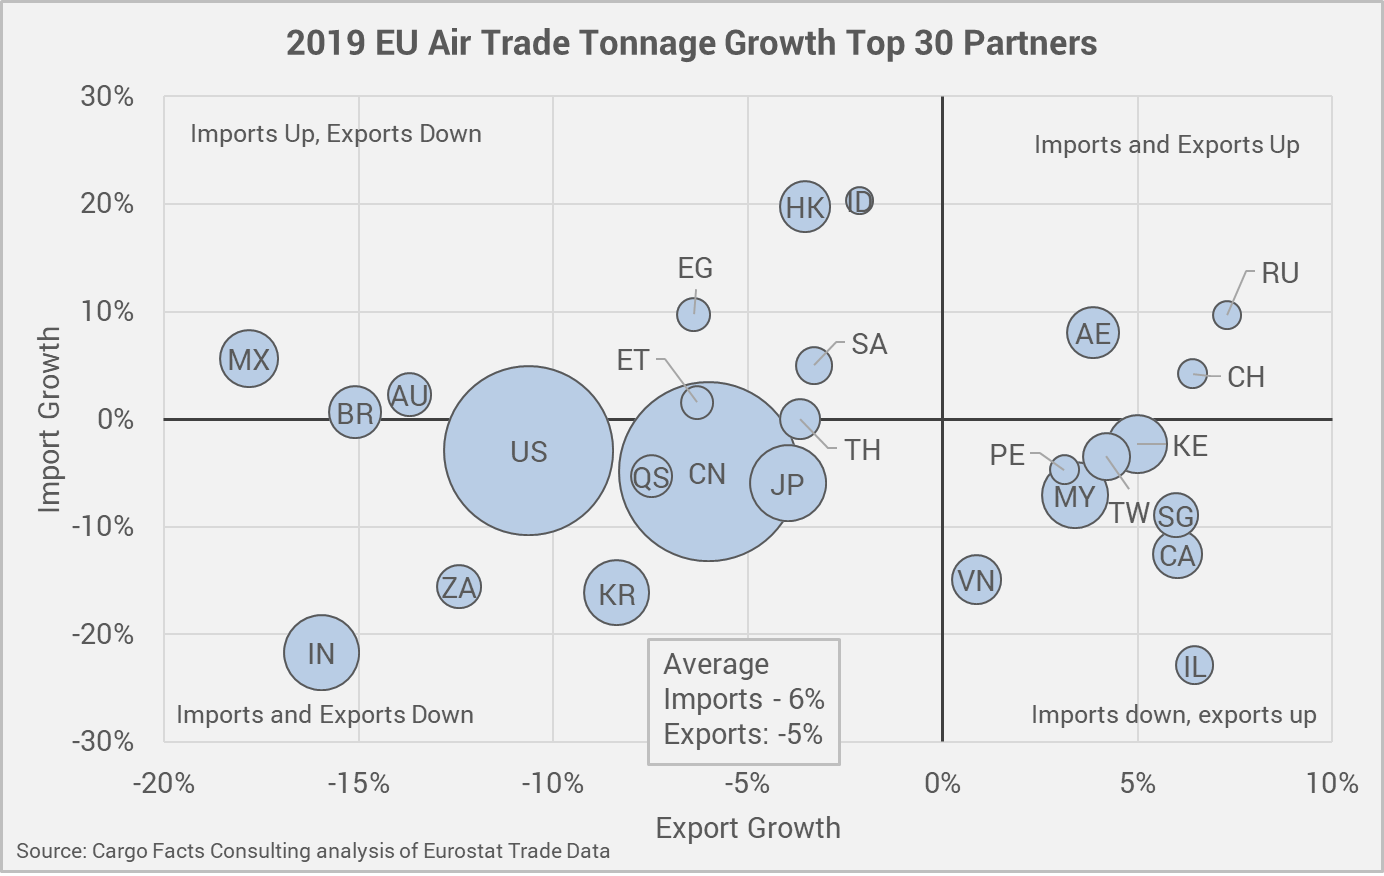
Other smaller markets paint a more mixed picture. For example, imports from Mexico and Hong Hong were up, but exports to these countries were down. Conversely, while imports from Malaysia, Korea and Vietnam were down exports to these countries were up.
Performance by EU Country
The interactive map below shows performance by individual European country as well as giving a sense of the relative importance of each EU country. The pop up shows further information on export vs import performance. Note that air trade figures do not necessarily correspond with the point or arrival or departure as many goods travel in bond until they reach their final destination or are already cleared for export at origin. For example, Luxembourg airport only shows air freight exports and imports of about 24,000 tonnes, but cargo volumes through the airport in 2019 were close to 900,000 tonnes.
Map – 2019 Air Trade Growth by Country
Some key takeaways:
- Germany, European largest air trade market and heavily dependent on industrial goods and car parts saw exports drop by 12% and imports by 13%.
- Dutch air imports were up 4% thanks to growth in flowers and perishable commodities, among others, but exports were slightly down by 1%. However, due to restrictions put on freighter operations in 2018 due to the 500,000 air traffic movements map.
- UK Air Imports were down 14% but exports grew by 1%.
- Belgium, saw air imports up by 31% driven by strong freighter growth particularly into Liege, which has become a mecca for cross border e-commerce, but also a preferred location for expanding operations by Ethiopian, Qatar Airways, and AirBridgeCargo, among others.
What’s in store for 2020
In January, we were expecting 2020 to turn out into a subdued year of growth following some stellar years for the business, with growth expected to be around 2-3%. However, our short term outlook for 2020 airfreight is evolving by the day as countries around the world introduce new restrictions to deal with the spread of COVID-19.
However, it is worth noting that lockdowns have primarily affected the service sector, in most cases industrial production continues – even in countries like Italy. Chinese production has started ramping up, although recent estimates point While demand for freighter capacity is extremely high due to large scale passenger flight cancellations, industry participants we have talked to confirm that the commodity mix is is different to usual and that directionality is changing from week to week. We expect that airfreight will remain volatile at least for the coming months until the situation has stabilized.
Many important airfreight commodities – machinery, automotive, textiles and consumer goods are likely to be weak or negative. There is unlikely to be much investment in new capacity requiring machinery in 2020 as companies focus on survival rather than growth. Perishable and pharmaceutical demand should hold steady.
Once people resume normal lives and demand starts to recover, there could be potential for a surge in airfreight in the second half of the year as companies rely on airfreight to replenish inventory levels and meet evolving demand. Container shipping volumes are expected to recover later once demand has stabilized.