First reports do not bode well for July
 As the months of the second quarter of 2015 rolled by, it became clear that the growth in airfreight demand seen in the last half of 2014 had not continued – that despite the one-time bump from modal shift in the first quarter of this year, underlying demand growth in 2015 was in the very low single-digits.
However, as IATA pointed out in its recent publication of first-half cargo data, even this low growth figure is misleading, because there has actually been a slight decline in traffic since the second half of 2014. The implication of IATA’s statement was that the first half of 2014 offered a weak comparison, and that once we got into the second half of 2015, and faced tougher comparisons, year-over-year growth could turn negative.
IATA said, however, “We are sticking with our view that economic growth and trade will accelerate in the second half of the year, strengthening growth in air cargo volumes.” Our view at Cargo Facts is that much hinges on Europe. The rest of the world’s major economic regions, perhaps excepting Latin America, seem reasonably (if not spectacularly) healthy, but until European companies and consumers are confident in the political and economic future of their union, growth will remain stalled.
With July data now in from some of the world’s major cargo carriers and airports, we see no reason to adjust our view. In fact, based on the historical relationship between the carriers and airports shown in the chart above, and the overall performance of the industry in a given month, we would not be surprised to see, when IATA publishes its July report in two weeks, that worldwide growth was flat with 2014, or had even turned slightly negative.
Now for the details…
Asia Pacific
Cathay Pacific Airways reported July cargo traffic up 1.4% y-o-y to 877 million RTKs. This is Cathay’s smallest year-over-year increase in sixteen months, since it began a trend of mostly double-digit growth in March 2014. For the first seven months of 2015, Cathay’s cargo traffic was up 9.0% to 5.98 billion RTKs. Commenting on the July results, Cathay Pacific General Manager Cargo Sales & Marketing Mark Sutch said: “After a flat second quarter, demand for air freight shipments remained below expectations throughout July. The growth in tonnage lagged the growth in capacity by a sizeable margin, which dragged down the month’s load factor. Yield remained under pressure due to overcapacity in a number of markets. Among the positive stories of the month, demand into and out of India continued to be ahead of expectations and we also saw an upsurge in project shipments out of Western China, and Chongqing in particular.”
Hong Kong International Airport reported cargo volume down 1.9% y-o-y in July to 363,000 tonnes. Export volume slipped 2.2% to 231,000 tonnes, and import volume was down 1.6% to 133,000 tonnes. After beginning the year on a positive note – combined January/February volume was up 7.2% – HKIA has seen year-over-year declines in every month since, and for the year through July reported its handle effectuveky flat (up 0.2%) with 1H14 at 2.5 million tonnes.
Beijing-based Air China continues to report exceptionally strong demand growth, with July cargo traffic up 27.1% y-o-y to 581 million RTKs. This is the carrier’s twelfth consecutive month of double-digit demand growth, and puts Air China’s cargo traffic for the first seven months of 2015 up 24.1% to 3.75 billion RTKs. The July growth was driven by a 33.9% increase in international traffic to 453 million RTKs, while domestic traffic rose 9.7% to 118 million RTKs.
Guangzhou-based China Southern Airlines reported July cargo traffic up 3.3% y-o-y, to 468 million RTKs. International traffic was up 6.1% to 341 million RTKs, but domestic traffic declined 3.9% to 125 million RTKs. For the first seven months of 2015, China Southern’s cargo traffic was up 10.1% to 3.04 billion RTKs.
Shanghai-based China Eastern Airlines reported July cargo traffic down 11.1% y-o-y to 373 million RTKs, just the latest in a series of ups and downs that has left the carrier’s cargo traffic for the first seven months of 2015 up 2.8% to 2.79 billion RTKs. China Eastern’s international cargo traffic in July was down 14.5% to 290 million RTKs, while domestic traffic was up 4.8% to 72 million RTKs.
Taiwan-based EVA Air reported July cargo traffic down 11.1% y-o-y to 307 million RTKs. For the seven months of 2015, EVA’s cargo traffic was down 7.1% to 2.33 billion RTKs.
Shanghai Pudong International Airport Cargo Terminals Co. Ltd (Pactl, the biggest cargo handler at PVG): reported its July handle up 7.3% y-o-y to 130,000 tonnes –almost identical increase and volume figures to what Pactl reported in June. International volume in July was up 7.3% to 122,000 tonnes, while the much smaller domestic volume jumped 14.8% to 8,000 tonnes. For the first seven months of 2015, Pactl’s handle was up 10.3% to 817,000 tonnes.
Singapore Airlines reported July cargo traffic down 5.0% y-o-y to 508 million RTKs. For the year through July, SIA’[s cargo traffic was up slightly (0.9%) compared to the same period in 2014, but this is almost entirely the result of a 17% increase in February, as the carrier has recorded declining traffic in all but one other month. Commenting on the July results, SIA said “Except for South West Pacific, load factor declined for all route regions as demand did not keep pace with capacity changes.”
Europe & Middle East
Lufthansa Cargo reported July traffic down 4.2% y-o-y to 707 million RTKs. For the Lufthansa Group as a whole, July cargo traffic was down 4.3% to 838 million RTKs. The decline reflects negative results on all three major trade lanes, with Group cargo traffic down 1.8% on the trans-Atlantic lane to 367 million RTKS, down 6.1% on the Asia-Europe lane to 379 million RTKs, and down 7.5% on the Middle East/Africa lane to 62 million RTKs. The July decline is an acceleration of the trend of slight year-over-year declines that began 18 months ago, and leaves Lufthansa Cargo’s traffic for the first seven months of 2015 down 1.0% from the same period last year at 4.85 billion RTKs. For the Lufthansa Group, cargo traffic through July was down 1.2% to 5.77 billion RTKs.
Air France-KLM continues to report dismal cargo results, with traffic down 10.4% y-o-y in July to 752 million RTKs. For the year through July, AF-KLM’s cargo traffic was down 9.8% to 5.21 billion RTKs.
International Airlines Group reported July cargo traffic down 7.0% y-o-y to 422 million RTKs. Subsidiary carrier Iberia turned in a good performance, with cargo traffic up 4.9% to 86 million RTKs, but this was not enough to compensate for a 9.7% drop at IAG’s larger British Airways subsidiary to 336 million RTKs. For the first seven months of 2015, IAG Cargo’s traffic was down 3.7% to 3.15 billion RTKs.
Turkish Airlines reported July cargo volume up 23.1% y-o-y to 62,000 tonnes. This is the third month of double-digit growth after the carrier started the year with four months of low-single-digit gains, and leaves Turkish’s first-half volume up 9.5% to 374,000 tonnes.
Frankfurt Airport (FRA) reported its July cargo handle down 2.0% y-o-y to 178,000 tonnes. For 2015 through July, FRA’s handle was down 1.9% to 1.22 million tonnes.
London’s Heathrow Airport (LHR) reported its July handle down 5.4% y-o-y to 121,000 tonnes. For the first seven months of 2015, LHR’s handle was up 1.0% to 863,000 tonnes.
Amsterdam’s Schiphol Airport reported its July cargo handle down 2.1% y-o-y to 134,000 tonnes. For the first seven months of 2015, AMS’ handle was down 2.1% to 918,000 tonnes.
Americas
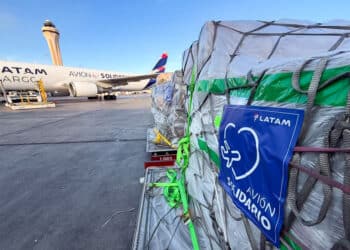
Cargo traffic continued to fall steeply at Chile-headquartered LATAM Airlines Group, which reported July traffic down 12.6% y-o-y to 303 million RTKs. The company said cargo traffic continued to be “weak in the Brazil domestic and international markets.” For the first seven months of 2015, LATAM’s cargo traffic was down 11.2% to 2.19 billion RTKs.
United Airlines reported July cargo traffic up 1.9% to 316 million RTKs, continuing (albeit at a low level) a period of growth growth that began in late 2013. For the year through July, United’s cargo traffic was up 7.9% to 2.05 billion RTKs.
American Airlines reported July cargo traffic down 4.5% to 278 million RTKs. For the first seven months of 2015, American’s cargo traffic was down 1.2% to 1.95 billion RTKs.
Delta Air Lines reported July cargo traffic down 12.7% y-o-y to 278 million RTKs. For the year through July, Delta’s cargo traffic was down 3.7% to 1.88 billion RTKs.

Cargo Facts Free Newsletters